Someone asked about this and I though the solution with ggplot2 was pretty neat. Imagine that you have a scatterplot with some points in the exact same coordinates, and to reduce overplotting you want to have the size of the dot indicating the number of data points that fall on it. At the same time you want to colour the points according to some categorical variable.
The sizeplot function in the plotrix package makes this type of scatterplot. However, it doesn’t do the colouring easily. I’m sure it’s quite possible with a better knowledge of base graphics, but I tend to prefer ggplot2. To construct the same type of plot we need to count the data points. For this, I use table( ), and then melt the contingency table and remove the zeroes.
library(ggplot2)
library(reshape2)
data <- data.frame(x=c(0, 0, 0, 0, 1, 1, 2, 2, 3, 3, 4, 4),
                   y=c(0, 0, 0, 3, 1, 1, 1, 2, 2, 1, 4, 4),
                   group=c(rep(1, 6), rep(2, 4), rep(3, 2)))
counts <- melt(table(data[1:2]))
colnames(counts) <- c(colnames(data)[1:2], "count")
counts <- subset(counts, count != 0)
sizeplot <- qplot(x=x, y=y, size=count, data=counts) + scale_size(range=c(5, 10))

This is the first sizeplot. (The original scale makes single points very tiny. Hence the custom scale for size. Play with the range values to taste!) To add colour, we merge the counts with the original data to get back the group information — and, in true ggplot2 fashion, map the group variable to colour.
counts.and.groups <- merge(counts, unique(data))
sizeplot.colour <- qplot(x=x, y=y, size=count,
                         colour=factor(group), data=counts.and.groups) +
                     scale_size(range=c(5, 10))
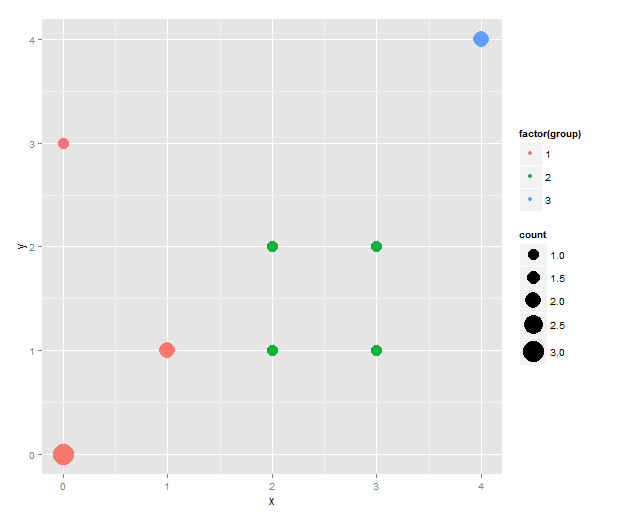
One thing that this simple script does not handle well is if points that should have different colour happen to overlap. (As it stands, this code will actually plot two points both the size of the total number of overlapping points in different colours on top of each other. That must be wrong in several ways.) However, I don’t know what would be the best behaviour in this instance. Maybe to count the number of overlaps separately and plot both points while adding some transparency to the points?
